By Josh Gray and Maria Monahan
Key points
- In 2023, there were 253,559 hospital-to-hospital transfers for Medicare fee-for-service patients with cancer diagnoses
- Among the top 20 hospital-based cancer programs as defined by U.S. News and World Report, there were 10,992 transfers for cancer patients
- Patients at these top programs had substantially lower mortality than expected
- Within these top cancer programs, patient acuity and mortality outcomes varied substantially
Introduction
Each year, thousands of cancer patients and their families face the difficult decision of whether to transfer from a community or rural hospital to a facility with more specialized oncology capabilities. In some cases, specialized programs might offer the potential of longer survival but lower quality of life, given the pain and discomfort of aggressive treatment, the disruption of the transfer itself, and being away from home during the patient’s last weeks or days.
We were curious to learn more about the patterns and outcomes for cancer patients who transfer from admitting hospitals to specialized cancer programs. Our data source is all Medicare fee-for-service admissions in 2023 to hospital-based cancer programs, with a particular focus on the top 20 cancer programs as designated by U.S. News and World Report (USNWR).
Better Outcomes at Top Programs
Table 1
Acuity and Outcomes of Transferred Cancer Inpatients, 2023

Substantial Variation Across Top Programs
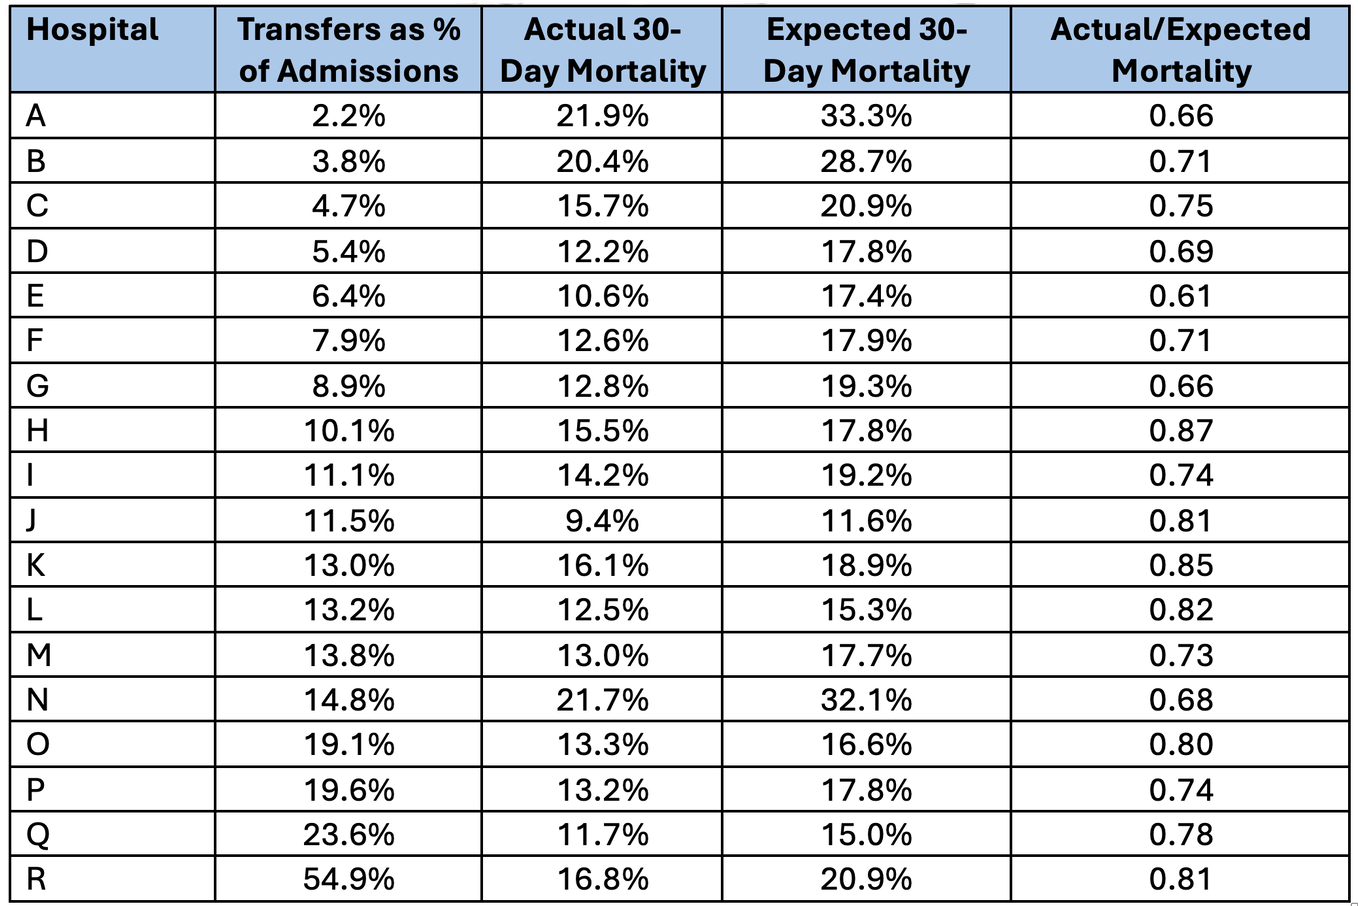
Although top USNWR cancer programs as a whole exhibited better outcomes for transferred patients, there was substantial variation in individual programs’ volume, acuity, and outcomes, as indicated in Table 2, which summarizes program-specific performance on an anonymized basis [2].
As an example, Hospital B had a low proportion of patient transfers (3.8%) but patients who transferred had a high expected mortality rate (28.7%). In contrast, transfers accounted for a much higher proportion of admissions for Program Q (23.6%) but acuity was much lower (expected mortality of 15%). Across programs, the proportion of admissions that were transfers from other hospitals ranged from 2.2% to 54.9%. Each of the top programs had better than expected 30-day post-admission mortality, with actual-to-expected mortality ranging from 0.61 to 0.87.
Table 2
Transfer Volumes and Actual to Mortality at Top USWNR Hospitals, 2023

Conclusion
To summarize, patients who are transferred to top hospital cancer programs have better than expected mortality outcomes. The proportion of patients that were transferred, as well as acuity and mortality outcomes, varied substantially.
If you work in inpatient [AR1] cancer care and would like to access this type of data for your program, please reach out. We would be happy to provide you with a complementary [AR2] overview of your program’s performance.
Josh Gray, VP of Analytic Services, HDAI ([email protected])
Maria Monahan , Data Analyst, Health Data Analytics Institute, HDAI ([email protected])
[1] Expected mortality of a cancer program was calculated as the actual mortality of similar patients (i.e., “digital twins”) identified throughout the nation who matched patients in the program based on a number of factors, including age, sex, enrollment status, geography, and recent medical history. Comparison of actual mortality rates between a program and its matched cohort provides an accurate, risk-adjusted performance assessment. The actual-to-expected ratio thus permits unbiased comparisons among programs having patients with different types of populations. A more complete description of HDAI’s methodology is available here.
[2] We deleted two programs from Table 2 because low volumes prevented us from reporting mortality rates required by Health Data Analytics Institute’s data use agreement with the Centers for Medicare and Medicaid Services.
SHARE
